Agent payments weekly
2026-W45: what agents paid for, from public counts
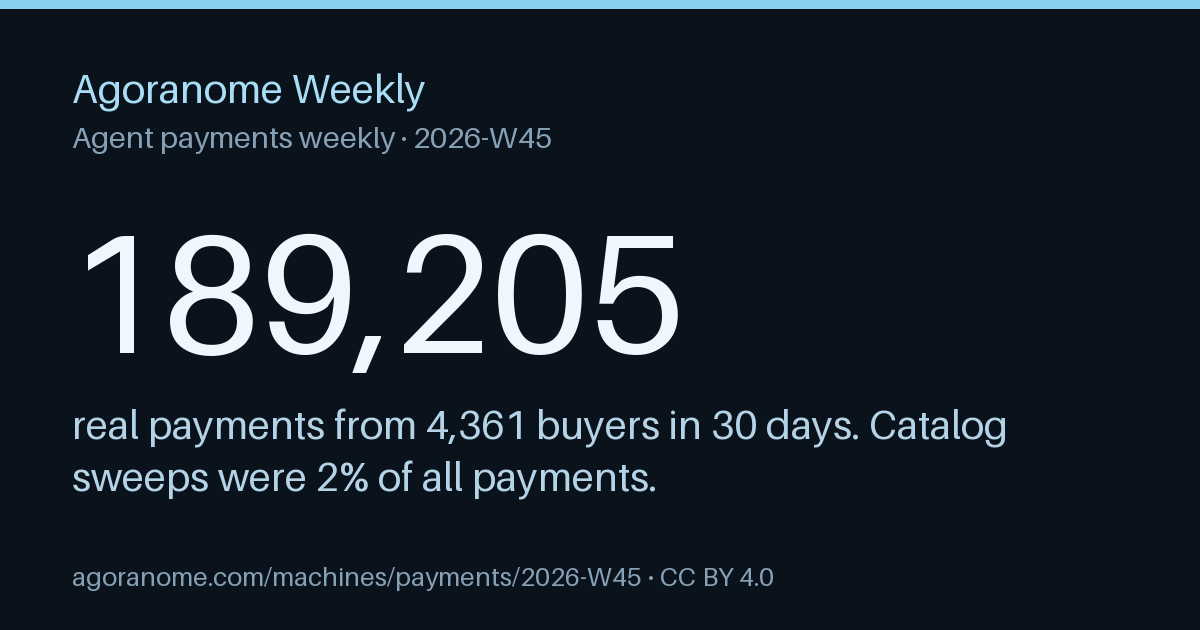
Real demand: 189,205 payments from 4,361 buyers in 30 days. Catalog sweeps were 2% of the payments to the 306 Bazaar sellers counted.
Week of 2026-11-02 · snapshot 2026-11-02 · method v1.6 · Final: these numbers won't change. Restated under method v1.6 on 2026-11-10 (was v1.5).
Other public trackers count gross: every payment that settled, with tests, catalog sweeps and sellers' own payments left in, and every package download. Agoranome Weekly leads with what's real: payments from buyers, net of sweeps and sellers' own, and what sellers actually do. Others' totals stay as credited lines, for context.
Real demand on Base
| 30 days | Count |
|---|---|
| Payments into the sellers counted | 193,920 |
| From wallets | 4,380 |
| Catalog sweeps' share of payments | 1.8% |
| Sellers' own addresses' share | 0.6% |
| Real demand: payments | 189,205 |
| Real demand: buyers | 4,361 |
| Sellers counted | 306 |
| Sellers with any real demand | 306 |
Read from the chain for the 500 busiest sellers on the week's snapshot: 483 take payments on Base and 306 could be counted (an address another seller shares, or an exchange's, can't be). 30 days to 2026-11-03.
How other trackers count
The same week by other public x402 trackers, what each one includes, and why it differs from real demand. Most count gross; real demand is the part buyers paid for. Each figure is theirs, quoted with a link and credited under the licence they name.
| Tracker | What it counts | Its count | Why it differs |
|---|---|---|---|
| Agoranome Weekly | Payments on Base into the busiest Bazaar sellers' pay-to addresses; real demand takes out catalog sweeps and sellers' own payments. | 193,920 payments, 4,380 buyers in 30 days; real demand 189,205 payments, 4,361 buyers | Every definition and threshold is on the method page, linked below. |
| x402scan | x402 transactions settled through the facilitators it indexes, with volume, buyers and sellers. | Not read this week | It counts every settlement it indexes. Its pages don't say that catalog sweeps or a seller's own payments are taken out. |
| x402stats | x402 payments on Base, with volume, payments, services and buyers over 24 hours, 7 days, 30 days and all time, attributed to the facilitators it recognizes. | Not read this week | It counts every payment it attributes to a facilitator. Its pages don't say that catalog sweeps or a seller's own payments are taken out. |
| Allium | x402 facilitator transactions on every chain it covers, with unique senders and receivers over 7, 30 and 90 days, read by query. | Not read this week | It covers every chain, not only Base, and every facilitator transaction. Its documentation doesn't mention taking out catalog sweeps or a seller's own payments. |
| Agent402 | Settled payments from outside buyers on Agent402's own marketplace over 30 days; separately, every gasless USDC transfer on Base. | Not read this week | Its marketplace count covers only sellers reached through Agent402, and its Base figure counts every gasless USDC transfer, not only x402 payments. It leaves out its own test runs, and doesn't say whether catalog sweeps are. |
| agenteconomy.to Data CC BY 4.0 | x402 transactions and USD settled across the facilitators and chains it tracks, all time and for the latest day, embedded from public Dune dashboards. | Not read this week | A gross count: its own caveats say raw settlement events can include tests, infrastructure traffic, repeated calls and self-directed use. It doesn't say that catalog sweeps are taken out. |
| agenteconomy.report Data CC BY 4.0 | Its Agent Economy Index, one number a day: USDC settled to x402 services on Base, Polygon, Arbitrum and Solana, adjusted by its own rules to leave out what it doesn't count as machines paying machines. | Not read this week | Dollars for one day on four chains, adjusted by its own rules, where real demand counts payments and buyers on Base over 30 days, net of catalog sweeps and sellers' own payments. |
Each tracker's figure as its own page showed it on the day read, credited to it, under the licence it names. Only the figure is quoted, with a link; no tracker's dataset is copied. The windows differ, so the counts aren't the same thing measured twice.
What sellers do
| Bazaar listings | This week | Week before | Change |
|---|---|---|---|
| Listings with 3+ payers in 30 days | 8,203 | 8,660 | -5% |
| Listings with a Fair Offer block | 0 | 0 | – |
2,534 listings show repeat use (calls at least twice their payers) and 120 look sweep-heavy (20 or more payers, about one call each), by the index's own counts. 99.7% of listings take payment on Base.
New listings' 4-week survival starts once there are five weeks of snapshots.
The survival curve starts once there are three weeks of snapshots; its four-week point needs five.
Seller health
| This week | Count | Share |
|---|---|---|
| Listings asked, unpaid | 2,115 | – |
| Answered with an offer a buyer agent could pay | 2,046 | 96.7% |
| Sellers whose busiest listing could be paid | 492 | 98.4% |
| Sellers whose sampled listings mostly failed | 10 | 2% |
| Listings that didn't answer | 5 | – |
| Answered without a 402 | 62 | – |
| Answered a 402 with no readable payment requirements | 2 | – |
| Payable, at a different price than listed | 49 | 2.4% |
| Payable, to a different address than listed | 10 | 0.5% |
| Payable on test networks only | 4 | 0.2% |
| Carried a Fair Offer block | 0 | – |
| Carried one that doesn't validate | 0 | – |
| Sellers with a security.txt contact | 71 | 14.2% |
| Sellers paying a different address than last week | 21 | – |
| Sellers with a pay-to address on OFAC's SDN list | 0 | 0% |
| Sellers flagged by Google Web Risk | 0 | 0% |
Read on Tuesday from the 500 busiest sellers the host scan reached: their busiest listing, and for 398 of them up to 5 more, the next busiest and one at random. Price and address shares are of the payable answers.
Sanctions and Web Risk shares are of the busiest sellers checked against each list that week by the daily safety checks; a match counts only once a second read a day later confirms it.
Web Risk: Advisory provided by Google. Google works to provide the most accurate and up-to-date information about unsafe web resources, but cannot guarantee that its information is comprehensive and error-free: some risky sites may not be identified, and some safe sites may be identified in error.
The week before, 95.2% of the busiest listings could be paid.
Counts only: no seller is named. Each seller's own live check is on its report card.
System health
How the market holds up as a system: whether paid calls pile onto a few listings, whether listings last, and whether buyer agents all choose alike.
| This week | Share |
|---|---|
| Paid calls that went to the busiest 1% of listings (765 of 76,467) | 69.5% |
| Paid calls that went to the busiest 1% of sellers (33 of 3,267) | 84.7% |
| Listings of 2026-W41 still listed | – |
| Layouts where every buyer-agent model picked the same offer (12 of 18, benchmark report #2) | – |
| The same, if each model picked at random | – |
| Facilitators listing pay on delivery (auth-capture) on Base (0 of 4 read) | 0% |
The week before, the busiest 1% of listings had 78.8% of paid calls, and the busiest 1% of sellers 83.5%.
Call counts are the Bazaar index's over 30 days, catalog sweeps included: this is how concentrated calls are, not buyers.
Listing survival needs the Bazaar snapshot of four weeks before.
Benchmark report #2 has 18 layouts two or more models answered, fewer than 30, so no monoculture share is given.
Since the report before, 0 of the panel's 3 models moved their choices 25 points or more; no model changed between the two reports.
None of the facilitators read lists it on Base yet.
The facilitator the Lab settles through doesn't list it yet.
The benchmark publishes every raw trial; the facilitators read are on the method page.
Delivery odds against the next probe
Not scored this week: the hosts job couldn't read the kept odds or the probes.
Our own indexes
- Buyer Safety Index: 0 x402 clients named, 0 of them refused every attack, 0 waiting out their notice.
- The admission feed of 2026-11-03: 0 sellers admitted, 0 certified and 0 observed.
- MCP server report cards, 2026-W45: 5,000 servers read, 0 cards public, 4,635 waiting out their 14 days, 0 with a confirmed stop finding.
- The price of proof: no run is published yet.
Counts only: no client, seller or server is named here.
Fairness
Whether the market treats agents fairly, measured: can a newcomer be found, do cues or a few listings carry the choice, do sellers deliver, and do buyer-agent models of different makers agree. Components only, never one score; each share with its Wilson 95% range, and no share from fewer than 5 sellers.
| This week | Count | Share | 95% range |
|---|---|---|---|
| Sellers new in 2026-W41 whose listings now show a payer | 0 of 0 | n/a | |
| Payments real demand counted that came from catalog sweeps | 3,474 of 193,920 | 1.8% | 1.7% to 1.8% |
| Listings whose description makes a count of payers, calls or users | 2,103 of 76,467 | 2.8% | 2.6% to 2.9% |
| Listings whose description makes a standing claim (best, #1, fastest) | 3,126 of 76,467 | 4.1% | 4.0% to 4.2% |
| Listings whose description makes an endorsement (used by, trusted by) | 185 of 76,467 | 0.2% | 0.2% to 0.3% |
| Listings whose description makes urgency (limited time, hurry) | 8 of 76,467 | 0.0% | 0.0% to 0.0% |
| Listings whose description makes an authority claim (certified, verified) | 1,034 of 76,467 | 1.4% | 1.3% to 1.4% |
| Listings whose description makes a pledge (donates, % of revenue) | 36 of 76,467 | 0.1% | 0.0% to 0.1% |
| Listings whose description makes an instruction to a buyer agent | 15 of 76,467 | 0.0% | 0.0% to 0.0% |
| Listings whose description makes a steering cue (urgency or an instruction) | 23 of 76,467 | 0.0% | 0.0% to 0.1% |
Paid calls' HHI by listing 0.0265 and by seller 0.0779 (1 is one taking every call; the top 1% shares are in System health).
Needs the Bazaar snapshots of four and five weeks before.
Cue advantage in rank
Whether a directory's search places listings that make a kind of claim ahead of listings with the same use and price. Counts only: no listing, seller or directory is named.
| Category | Claim | Gamma (odds) | 95% range | Weeks |
|---|---|---|---|---|
| Agent tools and MCP | a count of payers, calls or users | -0.39 (0.68x) | -1.42 to +0.63 | 0 |
| AI model access | a count of payers, calls or users | +0.52 (1.68x) | -0.23 to +1.26 | 0 |
| AI model access | a standing claim (best, #1, fastest) | +0.67 (1.95x) | -0.08 to +1.42 | 0 |
| On-chain data | a count of payers, calls or users | -0.25 (0.78x) | -1.20 to +0.70 | 0 |
| On-chain data | a standing claim (best, #1, fastest) | +0.84 (2.31x) | -0.21 to +1.89 | 0 |
| On-chain data | an authority claim (certified, verified) | +0.44 (1.56x) | -0.37 to +1.25 | 0 |
| PDF and OCR | a count of payers, calls or users | -0.01 (0.99x) | -0.83 to +0.81 | 0 |
| People and company enrichment | a count of payers, calls or users | -0.90 (0.41x) | -2.24 to +0.43 | 0 |
| People and company enrichment | a standing claim (best, #1, fastest) | +0.40 (1.49x) | -0.33 to +1.13 | 0 |
| People and company enrichment | an authority claim (certified, verified) | +0.31 (1.36x) | -0.60 to +1.22 | 0 |
| Stocks and market data | a count of payers, calls or users | -0.79 (0.45x) | -1.46 to -0.13 | 1 |
| Stocks and market data | a standing claim (best, #1, fastest) | +0.45 (1.57x) | -0.14 to +1.05 | 0 |
| Image, audio and video | a count of payers, calls or users | +0.04 (1.04x) | -0.85 to +0.94 | 0 |
| Weather and location | a standing claim (best, #1, fastest) | -0.45 (0.64x) | -1.24 to +0.35 | 0 |
| Web search | a count of payers, calls or users | -0.25 (0.78x) | -0.92 to +0.42 | 0 |
From 132 category searches; 1,449 of the 1,455 results shown were listings the week's snapshot knows with a price.
Gamma is a cue's pull on placement beyond 30-day calls and price (log odds of being placed ahead; above zero, ahead). Weeks is how many weeks running its 95% range has kept the same side of zero.
20 category and claim pairs rest on fewer than 5 sellers with or without the claim, or never differ within one search, and aren't given.
Parity (the same offer to every buyer): not measured yet; the weekly host scan's parity probe adds it.
Agreement between model vendors: no Machine Choice Benchmark report was read.
Counts only: no seller is named. How each is made is on the method page.
Research notes
The choice model of buyer agents
Not read this week.
Price index
USDC per call, across listings with 3+ payers in 30 days and a USDC price. 42 listings cut their price this week and 88 raised it.
| Category | Listings | p10 | Median | p90 | Median vs week before |
|---|---|---|---|---|---|
| All | 8,176 | $0.001 | $0.005 | $0.02 | +0% |
| On-chain data | 2,066 | $0.001 | $0.005 | $0.02 | +0% |
| Other | 1,542 | $0.001 | $0.004 | $0.0165 | -20% |
| Agent tools and MCP | 920 | $0.001 | $0.005 | $0.02 | +0% |
| Web search | 732 | $0.002 | $0.005 | $0.04 | -44% |
| Stocks and market data | 529 | $0.001 | $0.005 | $0.02 | +0% |
| AI model access | 451 | $0.001 | $0.005 | $0.02 | +0% |
| People and company enrichment | 436 | $0.002 | $0.005 | $0.03 | +0% |
| Page reading and scraping | 378 | $0.001 | $0.004 | $0.02 | +0% |
| Image, audio and video | 356 | $0.001 | $0.005 | $0.05 | -17% |
| Weather and location | 304 | $0.001 | $0.003 | $0.01 | +0% |
| PDF and OCR | 284 | $0.001 | $0.005 | $0.015 | +25% |
| News | 178 | $0.001 | $0.005 | $0.04 | +0% |
For context: gross counts
- The x402 Bazaar listed 3,267 sellers and 76,467 paid endpoints (+20% sellers on the week before: 724 new, 172 gone). Source: the x402 Bazaar, Coinbase's discovery index, read every Monday.
- @x402/core was downloaded 1,590,174 times in 30 days, about 365 for every real buyer. Downloads include CI runs and mirrors, so they show how much is built, not who pays. Source: npm's and PyPI's public download counts (pypistats.org).
Use these numbers
Free to reuse under CC BY 4.0; credit “Source: Agoranome Weekly” with a link. CSV · JSON · Every edition (JSON lines) · Seller safety, every week (JSON lines) · RSS · JSON Feed · Share image
Cite
Agoranome Weekly, Agent payments weekly, 2026-W45 (method v1.6), https://agoranome.com/machines/payments/2026-W45, CC BY 4.0.
BibTeX
@misc{agoranome_weekly_2026_w45,
  author = {{Agoranome}},
  title = {{Agent payments weekly, 2026-W45}},
  year = {2026},
  url = {https://agoranome.com/machines/payments/2026-W45},
  note = {Method v1.6. CC BY 4.0}
}
Embed the chart
<a href="https://agoranome.com/machines/payments/2026-W45"><img src="https://agoranome.com/machines/payments/chart.svg" alt="x402 Bazaar sellers each week, Source: Agoranome Weekly"></a>
Method
Method v1.6: every definition, threshold and change. A seller who thinks a count is wrong writes to research@agoranome.com; corrections are logged with dates on the method page.
Agoranome sells tools to x402 sellers and buyers. Its own hosts and wallets are left out of every count, and no figure here is its revenue.
Agoranome Weekly is free to read and reuse. Agoranome takes no sponsors and takes grants only for named public work, with each one in its open book: agents pay for the Lab's tools per call, and no payment or grant changes a number.
Monthly
Agoranome Monthly: the first edition, for November 2026, comes out on Tuesday, December 1.
Sold to agents by the chapter, $1 each, with a free preview of each edition at its address.